
How To Make Trigger In Zabbix FOr CPU And Memory Utilisation
Posted By :Kapil Soni |29th July 2022
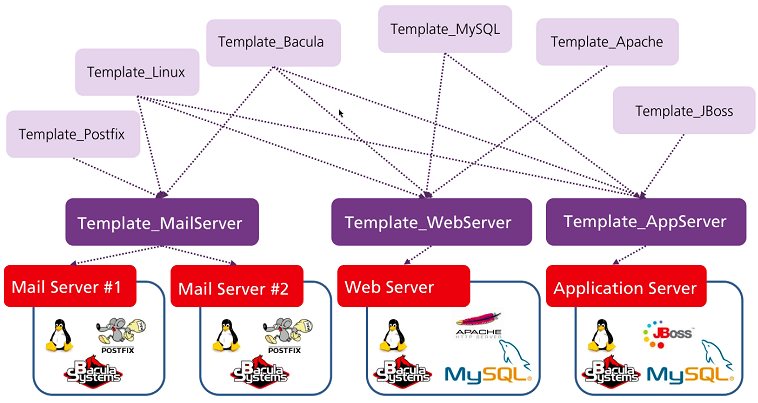
What is Zabbix Template?
The use of templates is a great technique to simplify Zabbix management. It is possible to attach a group of things (items, triggers, graphs, apps, screens, discovery rules, and online scenarios) to a template, making it possible to handle thousands of devices effectively.
How We Can Create Zabbix Template?
1. Create a new Zabbix template
Navigate to Configuration -> Templates. Create a template and include the template's name, group, and description.
2. Add macros
We want to monitor these three parameters:
+++++++++++++++++++++++++++++++++++++++++++++++++++
1. number of processes, with alerting if it is less than a certain value
2. memory usage, with alerting on high usage
3. CPU usage, with alerting on high load
+++++++++++++++++++++++++++++++++++++++++++++++++++++
So, let’s create default values for it. We can use macros as placeholders to be able redefine these values in the host configuration.
In this example we created 6 macros:
++++++++++++++++++++++++++++++++++++++++++++++++++++
{$PROC_CPU_MAX} => 70
{$PROC_MEM_MAX} => 2000000000
{$PROC_COUNT_MIN} => 1
{$PROC_NAME} => apache2
{$PROC_CPU_NORM} => 10
{$PROC_MEM_NORM} => 1000000000
++++++++++++++++++++++++++++++++++++++++++++++++++++++
Here you can see CPU max usage 70%, max memory limit 2G, minimum 1 process running, and process name apache2 for example. To avoid a flapping state, we need define normal trigger hysteresis values. So we also defined {$PROC_CPU_NORM} as 10% and {$PROC_MEM_NORM} as 1G.
3. Add items
Now we need to add incoming data items. Go to the Items menu under the current template and click Create item button. Create 3 items:
******************************************************
number of processes
CPU usage
memory usage
*****************************************************
You can use macros {$PROC_NAME} as a placeholder for the process name to be able to change it in the host configuration. So add these 3 items with 3 Keys:
******************************
proc.num[{$PROC_NAME}]
proc.cpu.util[{$PROC_NAME}]
proc.mem[{$PROC_NAME}]
******************************
Be careful, some parameters have different value types. For example, proc.num, proc.mem has Numeric (int), but proc.CPU.util has Numeric (float).You may check it in Key -> Select constructor or the official Zabbix manual.
4. Triggers with hysteresis
Now we need to create triggers. Let’s construct it. Go to the template Triggers menu. You can use the built-in Zabbix constructor by clicking the Problem expression -> Add button, selecting the item and function. For example last (most recent) T value. But it’s only one value. It can change every time. The count function is superior for detecting hard status when the same number appears numerous times. You can get more information about functions on Zabbix's official documentation.
So we want to create a trigger problem expression which will be fired when memory usage will greater than {$PROC_MEM_MAX} 3 times in a row.
{Template_name:proc.mem[{$PROC_NAME}].count(#3,{$PROC_MEM_MAX},gt)}>=3
(/Zabbix Main Server SecureNow/proc.cpu.util[{$PROC_NAME}],1)>=1
This expression can be read as: "count of the last three (#3) values that were greater (gt) than {$PROC_MEM_MAX} at least three times." This means that the last (most recent) 3 item values were greater than PROC_MEM_MAX 3 times in a row. So each of these three values was greater than the maximum. It is a good solution to detect the hard state of the problem.
This expression can be viewed as the count of the past three (3) item values that were less than or equivalent to {$PROC_MEM_NORM} at least three times.
***********************************************************************************
{Linux process monitoring:proc.mem[{$PROC_NAME}].count(#3,{$PROC_MEM_MAX},gt)}>=3
{Linux process monitoring:proc.mem[{$PROC_NAME}].count(#3,{$PROC_MEM_NORM},le)}>=3
{Linux process monitoring:proc.cpu.util[{$PROC_NAME}].count(#3,{$PROC_CPU_MAX},gt)}>=3
{Linux process monitoring:proc.cpu.util[{$PROC_NAME}].count(#3,{$PROC_CPU_NORM},le)}>=3
{Linux process monitoring:proc.num[{$PROC_NAME}].count(#3,{$PROC_COUNT_MIN},lt)}>=3
{Linux process monitoring:proc.num[{$PROC_NAME}].count(#3,{$PROC_COUNT_MIN},ge)}>=3
***********************************************************************************
5. Configure the host
Now we can add this template to our host. Go to Configuration -> Hosts -> your server -> Templates.Add your brand new template to the server. Then we need to add according to macros.
How is Zabbix monitoring implemented?
Zabbix offers three choices for discovery mode: An IT environment is periodically scanned by network discovery, which logs the type, IP address, status, uptimes, and downtimes of each device. Low-level discovery uses the detected device to automatically construct items, triggers, and graphs.
All done! Congratulations! We can now check our data using the Monitoring -> Latest data option.
Ready to innovate ? Let's get in touch

Follow us


We are ISO 9001:2015 Certified
Resources

Connect with us

Follow us
![]()
![]()
![]()
![]()
![]()
![]()
![]()