
Monitoring Tools
Posted By :Nitin Kumar Kashyap |25th February 2021
Monitoring Tools
Monitoring tools are the essence of business for ensuring the necessary systems for running. To monitor many aspects of infrastructure setup cause s lot of tantrum for not properly with the correct tools.
It is one of the best things which make administrations of an open-source server of network monitoring and Linux monitoring tools for comes chunked of a number pre-installed applications of monitoring servers and other applications.
Nagios
Nagios is the open source monitoring tools for computer nodes. It was designed to execute or run on the Linux based operating system and can monitor devices running on multiple operating systems such as Linux, Unix and windows.
Nagios runs periodic checks on some critical parameters fo the applications, network and server resources. Nagios originally called NetSaint which is released in 1999 developed by Ethan Galstad which is subsequently contributors to an open-source project.
It can monitor memory usage, disk usage, microprocessor load, the number of currently running processes and log files. It also monitors services, such as HTTP, POP3 and SMTP are the common networking protocols.
Nagios proved popular among small and large business for internet service providers, healthcare institutions etc.
Some other products of Nagios provided such as Nagios Core and Nagios XI.
Nagios Core
Nagios Core is a freely available open-source monitoring software for the systems infrastructure and networks. It contains a wide array of infrastructure monitoring through plugins to extend monitoring systems. Nagios Core is monitor network services such as SMTP, HTTP and Ping protocols.
Nagios XI
Nagios XI is an upgraded version of Nagios Core, intend as the enterprise-level of monitoring tool. It acts as monitoring software, configuration manager and toolkit. Nagios Core is a freely available version until Nagios enterprises version which are purchased. Some features of core and XI add configured VM’s, UI and other performing graphics etc. Nagios XI is an infrastructure component of applications, OS’s, Network and systems metrics of the plugin also supported by infrastructure components to expands monitoring capabilities.
Grafana
It is an open-source visualization and analytics tool. Grafana allows you to query, visualize, alerts on and explore your metrics no matter where you stored. It shows your data in the form of attractive and understandable graphs and visualizes tables of Time Series DataBase format.
It will be working after creating dashboards like you for a kickstart for many possible things you might do next. It all depends on your needs and your use cases.
It explores your data with the help of ad-hoc queries (means with the use of commands) and dynamic drill down. It split view and compare different form of time ranges, queries and data sources of side by side.
It creates alert send through a number of different alert notifiers, including pagerduty, SMS, Email, OpsGenie, or Slack, VictorOps. It creates hooks that allow you to create different notifiers with a bit code if you prefer some other channels of commute.
It is another open-source tool that is used for creating alerts and monitoring purposes build at Soundcloud. Its inception in 2012, most of the companies and organizations have adopted Prometheus, and the project has a very active developer and community. It is also now a standalone open-source project which is maintained independently of any company. For the clarification of the project governance structure, Prometheus was joined CNCF(Cloud Native Computing Foundation) in 2016 and the second hosted project is after Kubernetes.
Features Of Prometheus
-
A multidimensional data models of time series of data identified metric key-value pairs and names.
-
A flexible query language for the leverage of dimensionally of PromQL.
-
Distributed storage of no reliance on single server nodes of autonomous.
-
Collection of time series happens via a pull model of over an HTTP.
-
It is also supported via an intermediary gateway of pushing time series.
-
Different modes of graphing.
-
It has also multiple dashboards supports.
-
To discovered targets via service discovery or static configurations of Prometheus.
Components
Some of the major components of Prometheus are.
-
The main server scapes & stores data in the form of time series.
-
It also provides client libraries for instrumenting application codes.
-
A gateway for push supporting and short-lived jobs.
-
For special-purpose exporters for services like stats and graphics etc.
-
For handles the alerts it has an alert manager.
-
It also supports a various range of tools.
Its components are written in the GO languages which make him easy to build and deploy with static binaries.
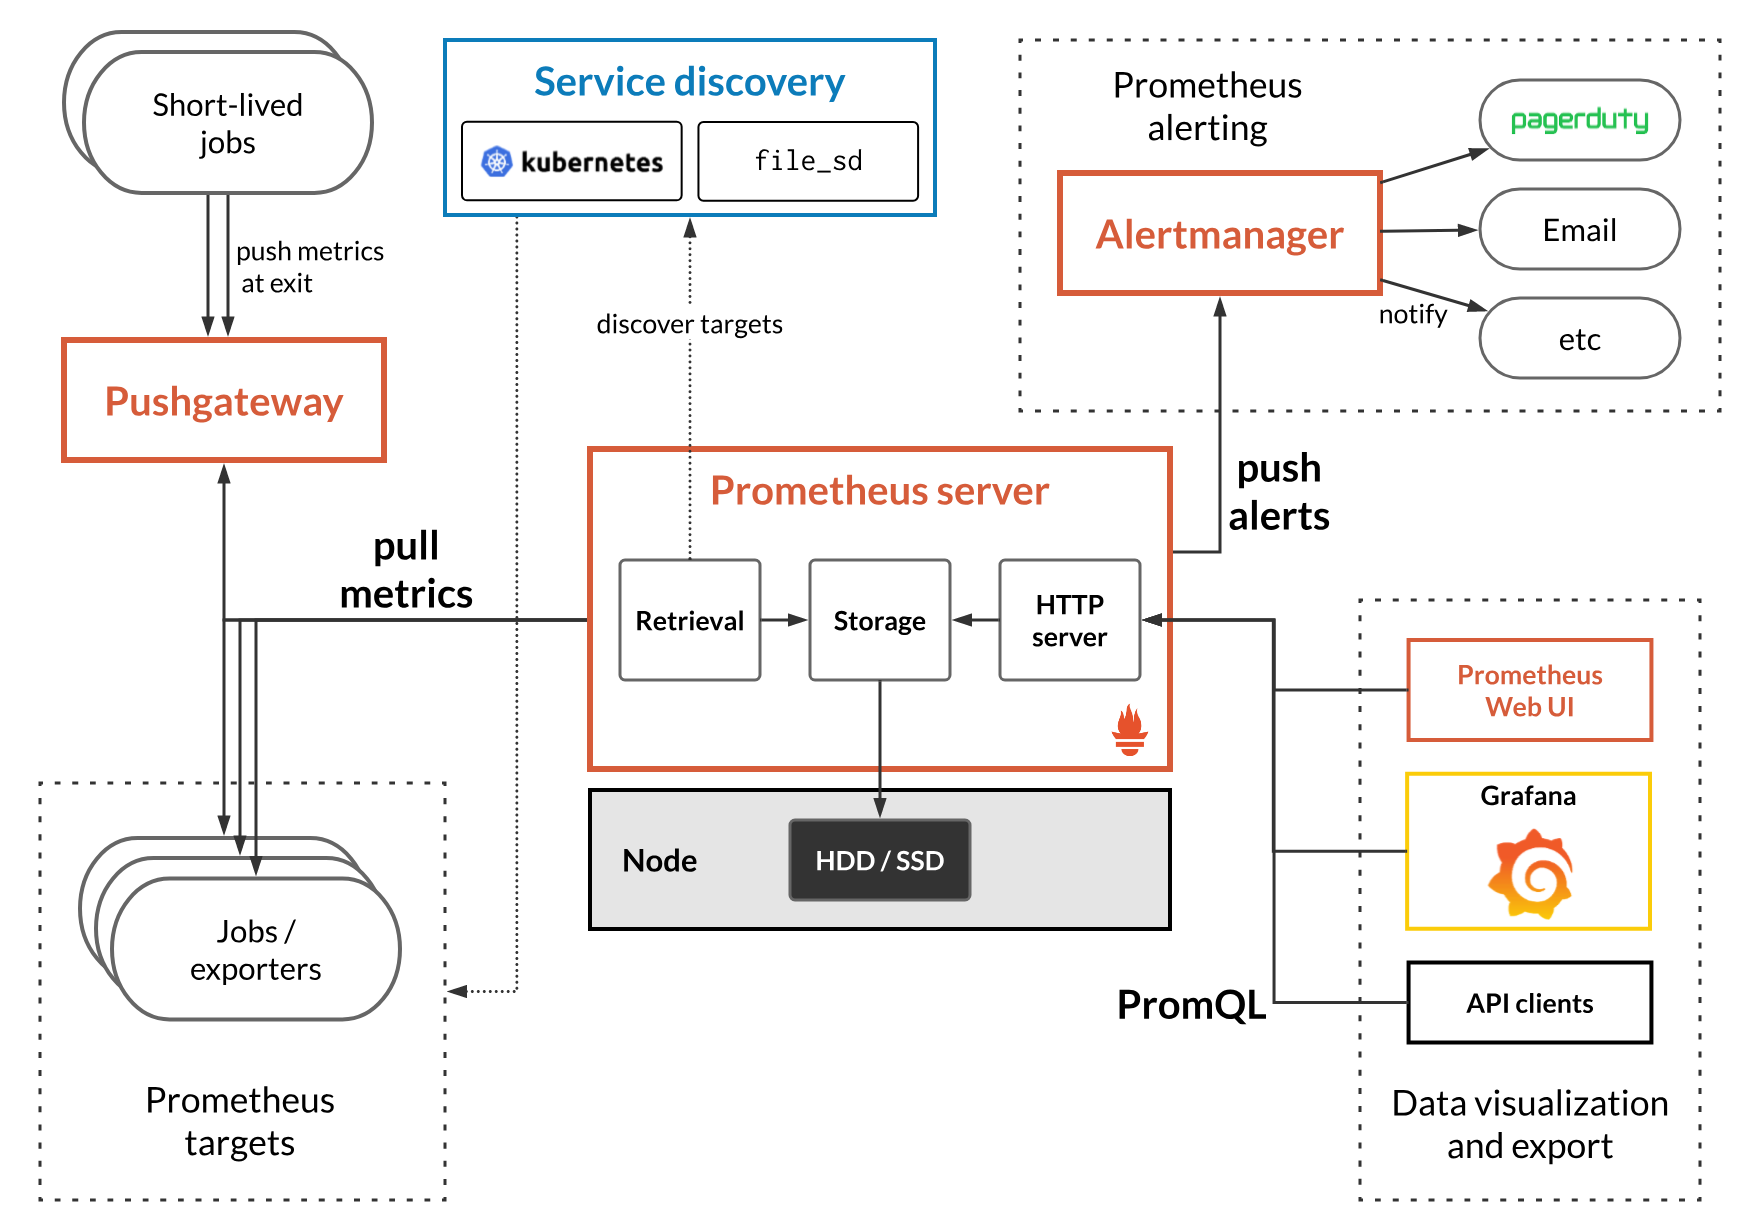
Architecture
It provides scrape metrics for instrumented jobs for directly or via mediatory gateway for short jobs.
It store most scrape samples locally and rules for data aggregate and record for newer time series from existing data or generate alerts or times. Other API consumers should be used to visualize the data for collected.
This diagram describes the architecture of Prometheus and its ecosystem components:
Ready to innovate ? Let's get in touch

Follow us


We are ISO 9001:2015 Certified
Resources

Connect with us

Follow us
![]()
![]()
![]()
![]()
![]()
![]()
![]()